Highlights
Profit & Loss For Financial Year ended 31 December 2024
| RM'000 | FY2024 | FY2023 |
|---|---|---|
| Gross revenue | 124,804 | 111,497 |
| Direct cost & property expenses | (61,919) | (51,451) |
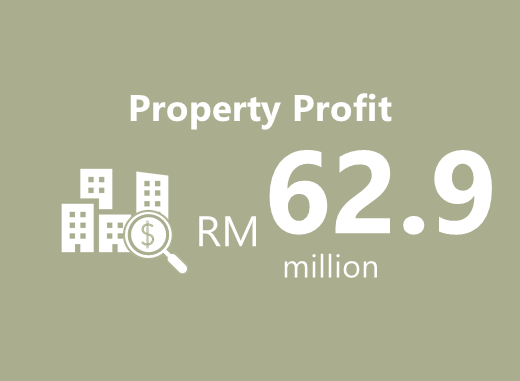
| Net property income (NPI) | 62,885 | 60,046 |
| Net income | 25,297 | 51,696 |
| Earnings per Unit | 3.59 | 9.81 |
| Net income — realised | 19,992 | 25,104 |
| Net income per Unit — realised[1] | 2.92 sen | 5.02 sen |
| Income distribution | 22.296 | 26,840 |
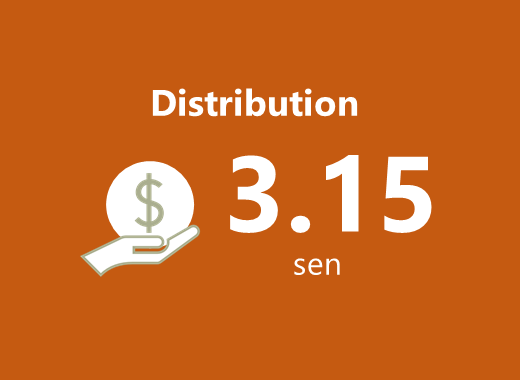
| Distribution Per Unit (DPU) | 3.15 sen | 5.00 sen |
| Change in Unit price | (9.5) sen | (5.0) sen |
| Annual total return per Unit | (6.4) sen | 0.0 sen |
| Annual total return per Unit[2] | (9.8%) | 0.0% |
Balance sheet As at 31 December 2024
| FY2024 | FY2023 | |
|---|---|---|
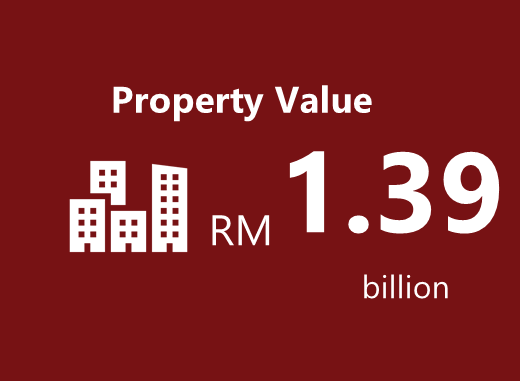
| Total assets (RM ‘000) | 1,434,024 | 1,314,849 |
| Total liabilities (RM ‘000) | 691,923 | 642,120 |
| Total borrowings (RM ‘000) | 598,273 | 562,228 |
| Gearing ratio | 41.72% | 42.76% |
| No. of units in circulation (units) | 709,287 | 581,415 |
| Net Asset Value (“NAV”) | 742,101 | 672,730 |
| NAV per unit (RM) | 1.05 | 1.16 |
| NAV – before income distribution (RM ‘000) | 742,101 | 672,730 |
| NAV – after income distribution (RM ‘000) | 733,235 | 659,357 |
| NAV per unit before income distribution (RM) | 1.05 | 1.16 |
| NAV per unit after income distribution (RM) | 1.03 | 1.13 |
| Lowest NAV during the period (RM) | 1.04 | 1.16 |
| Highest NAV during the period (RM) | 1.06 | 1.27 |
| Unit Price as at 31 December (RM) | 0.56 | 0.65 |
| Premium/(Discount) to NAV | (46.31%)) | (43.97%) |
Note: NAV based on quarterly filings.
DISCLAIMER: This annual report may contain forward-looking statements that involve risks and uncertainties. Past performance is not necessarily indicative of future performance and investment returns may fluctuate. Actual future performance and results may vary materially from those expressed or implied in forward-looking statements as a result of a number of risks, uncertainties and assumptions. You are cautioned not to place undue reliance on these forward-looking statements which are based on the Manager’s current view of future events.
Unit price statistics FY2024
| High | RM0.72 |
| Low | RM0.51 |
| Opening Price (2 Jan 2024) | RM0.65 |
| Closing Price (31 Dec 2024) | RM0.56 |
| Change in price | -14.6% |
Average total return
Based on the Total Return and the Opening Price of each year.
| For 1 year (2024) | -9.8% |
| For 3 years (2022-2024) | 47.8% |
| For 5 years (2020-2024) | -24.5% |
Annualised total return
Based on the Total Return of each year and the Opening Price as at 31 December 2024.
| For 3 years (2022-2024) | 13.9% |
| For 5 years (2020-2024) | -5.5% |
| For 10 years (2015-2024) | -1.4% |
Debt expiry profile 2025-2033
(Tap or mouse-over individual bars for more details)
| Year | % Debt |
|---|---|
| 2025 | 19.2 million |
| 2026 | 25.9 million |
| 2027-2033 | 553.2 million |
